
Analysis & forecasts
Your figures, readable at last.
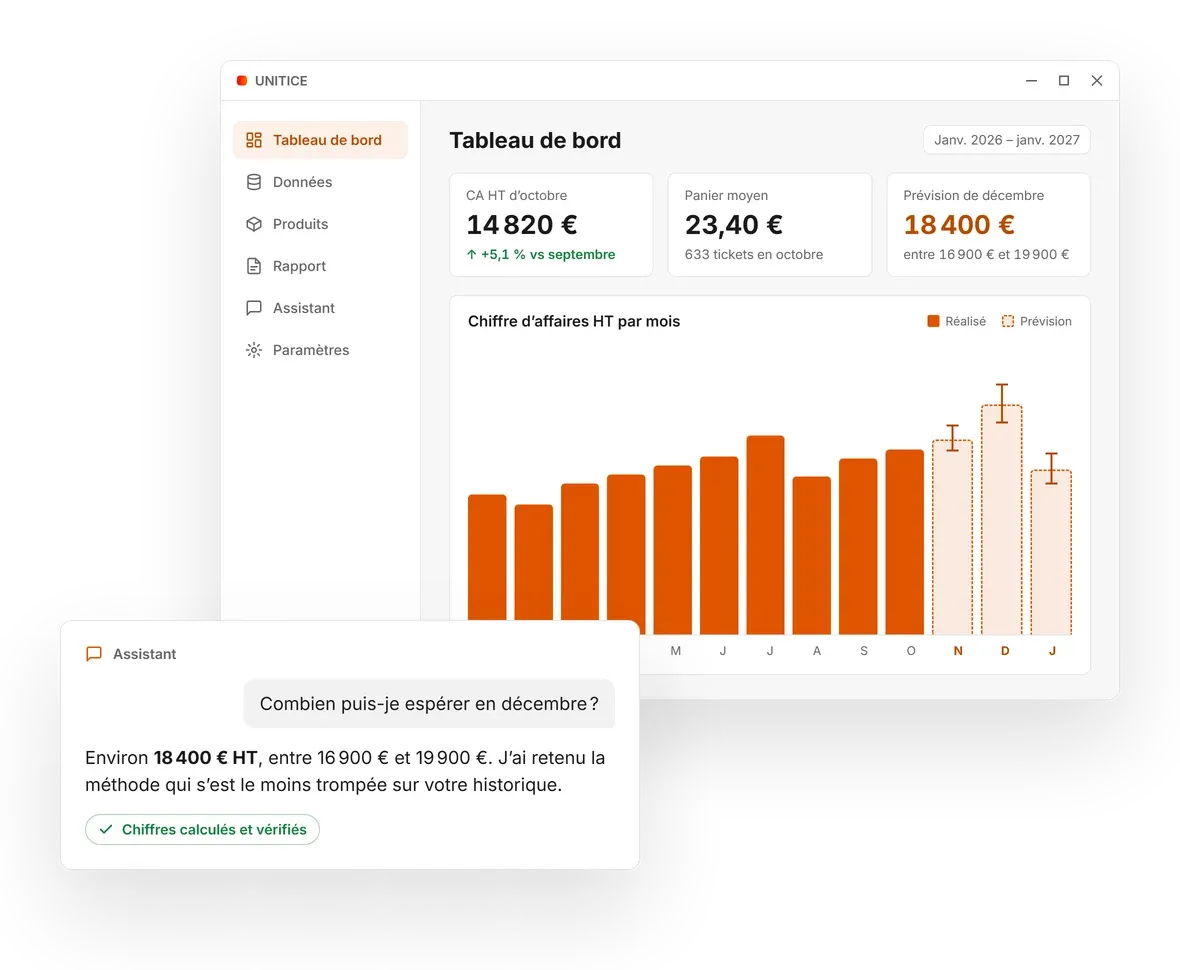
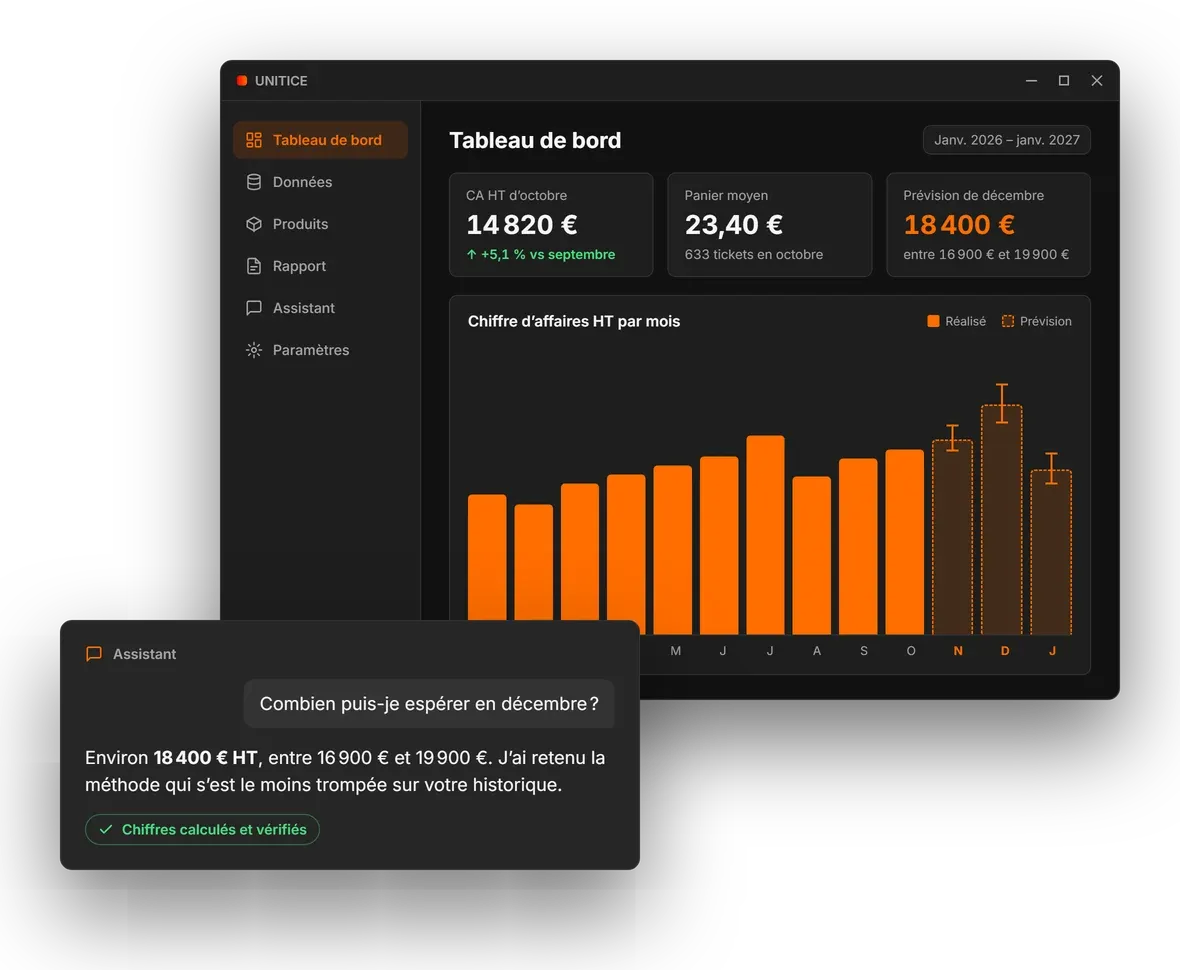
Import your sales, ask your questions in French. UNITICE calculates, explains and anticipates your coming months.
- Compatible with your files, whatever your till
- Your data stays on your station
- Artificial intelligence hosted in Europe
Statistics
Your year, day by day.
Each cell is a day of sales. Seasons, busy weekends and quiet days show at a glance.
Statistics
Who your customers are, and where they come from.
Types, reservation channel, nationalities: your customers summed up in a few charts.
- Direct46 %
- Platforms28 %
- Website18 %
- Agencies8 %
Assistant
Ask your questions in French. (AI)
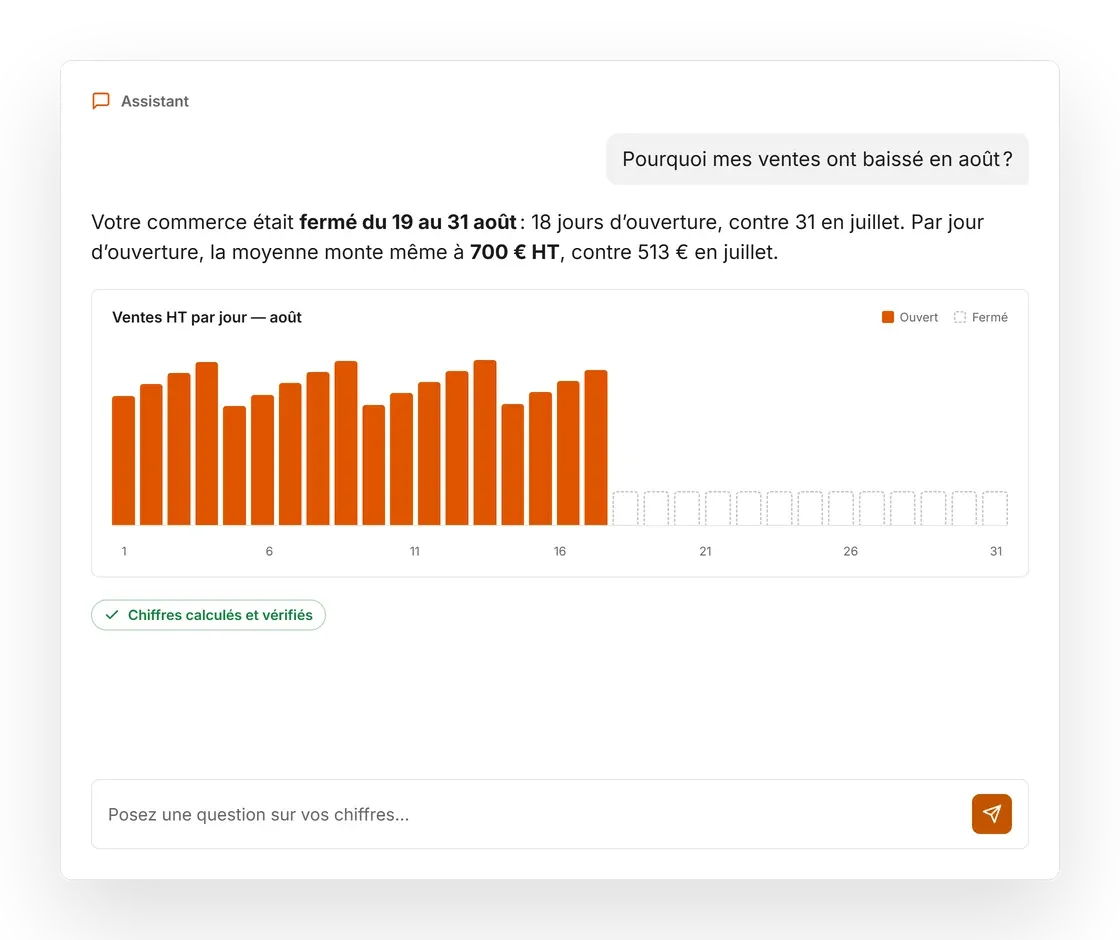
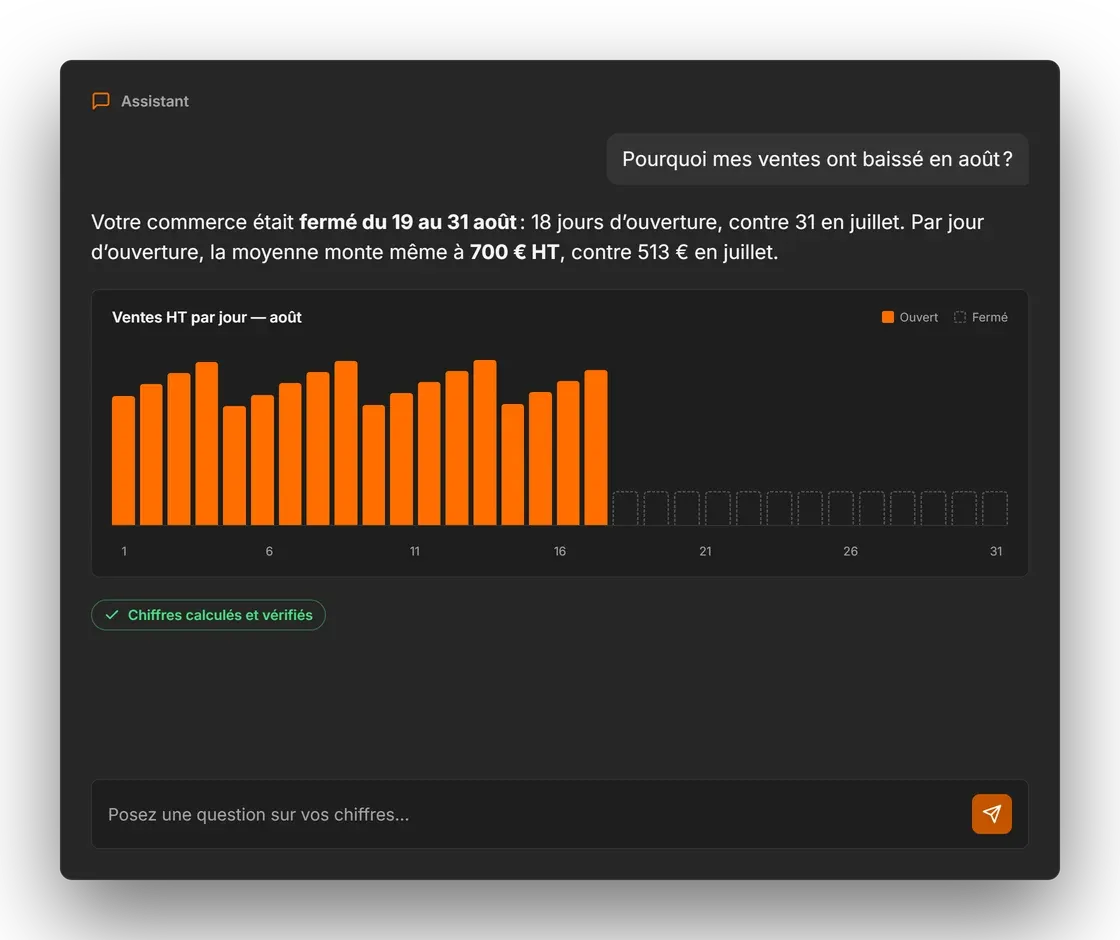
Why did this month drop? Which product does best? The assistant answers with your figures, and a chart when it is useful.
Verified figures
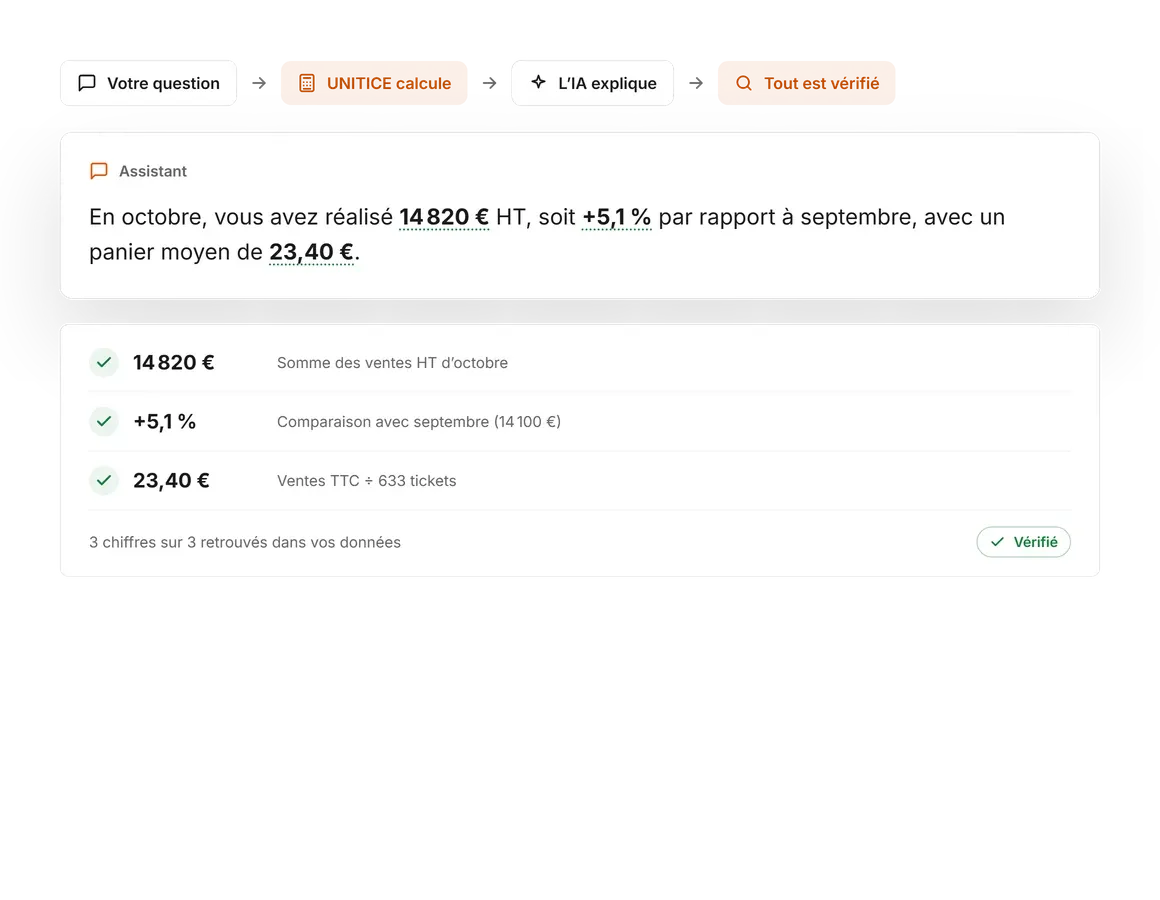
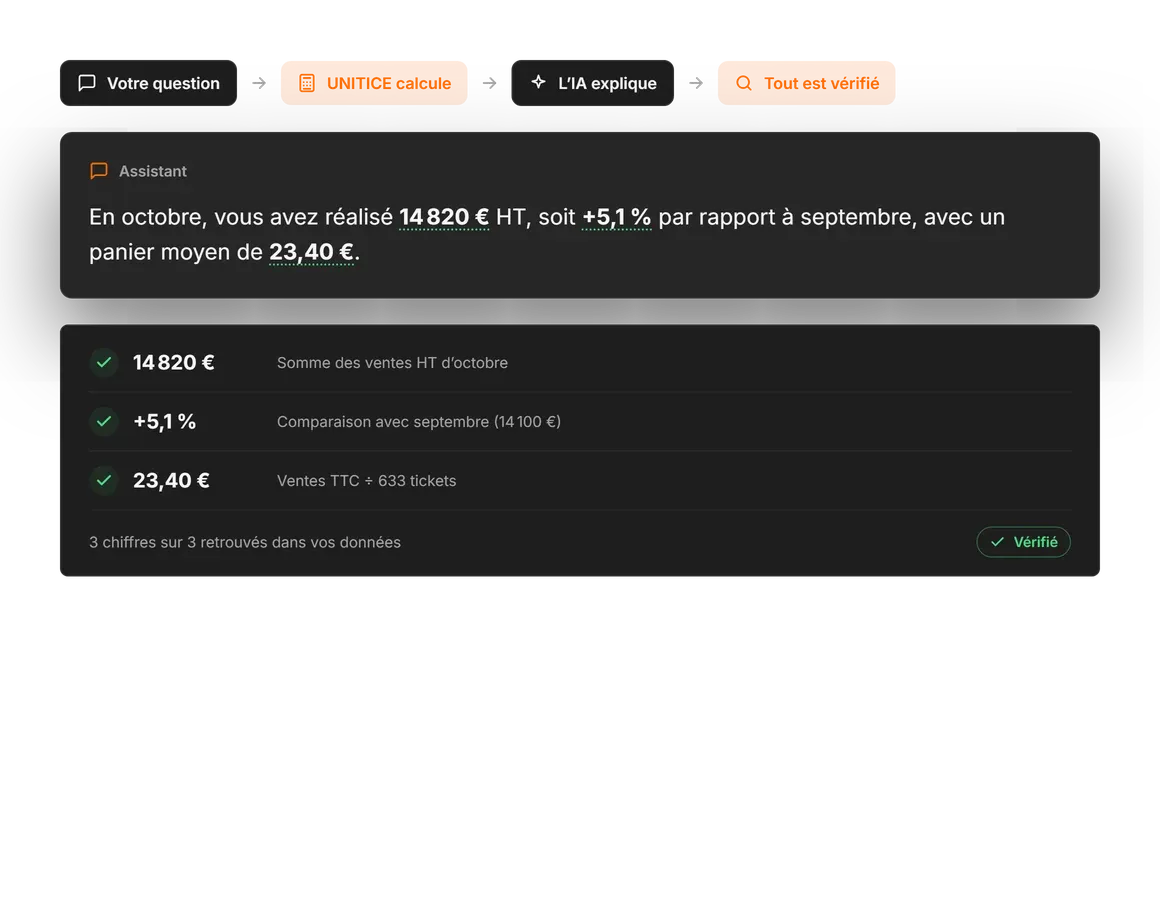
The AI explains. The calculation does not get it wrong. (AI)
Each amount is calculated by UNITICE from your data, then checked in the reply. The AI does not invent your figures.
Forecasts
Anticipate the months ahead.
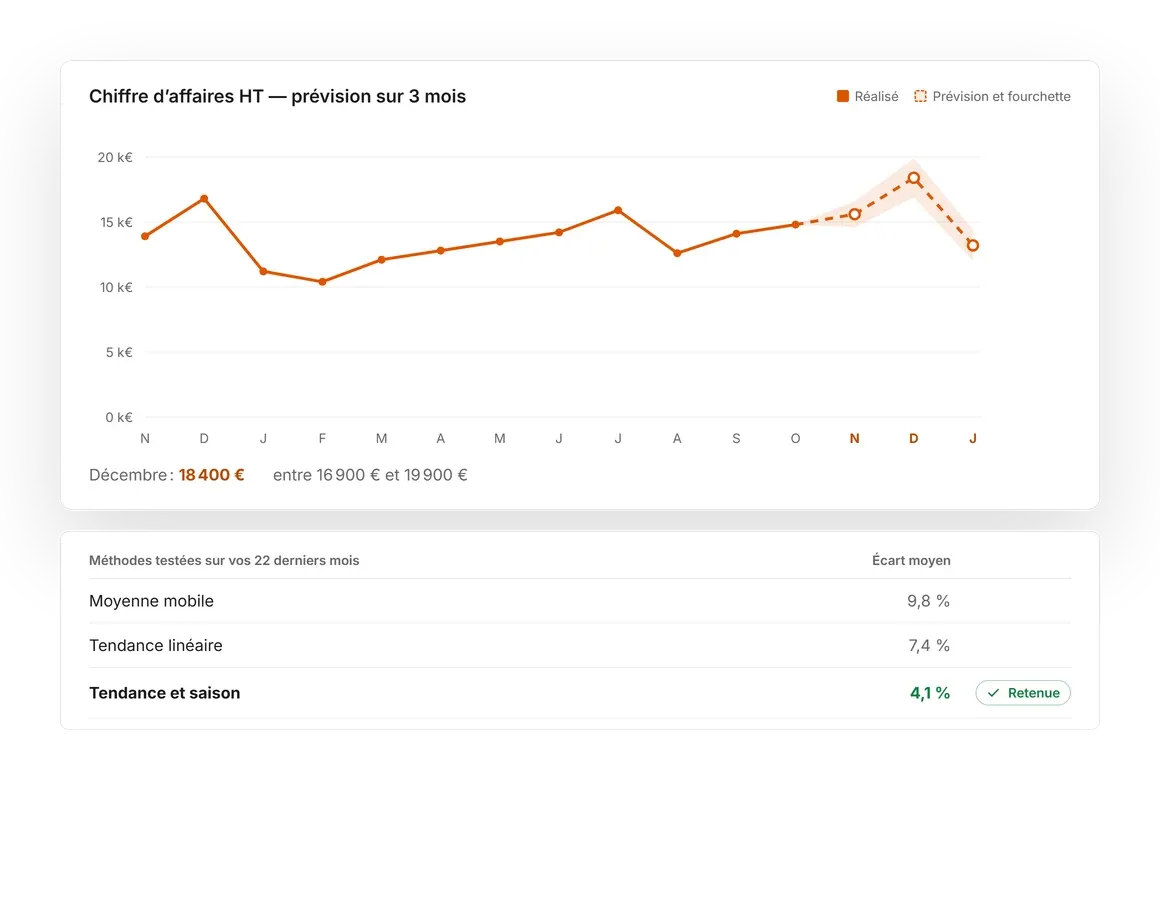
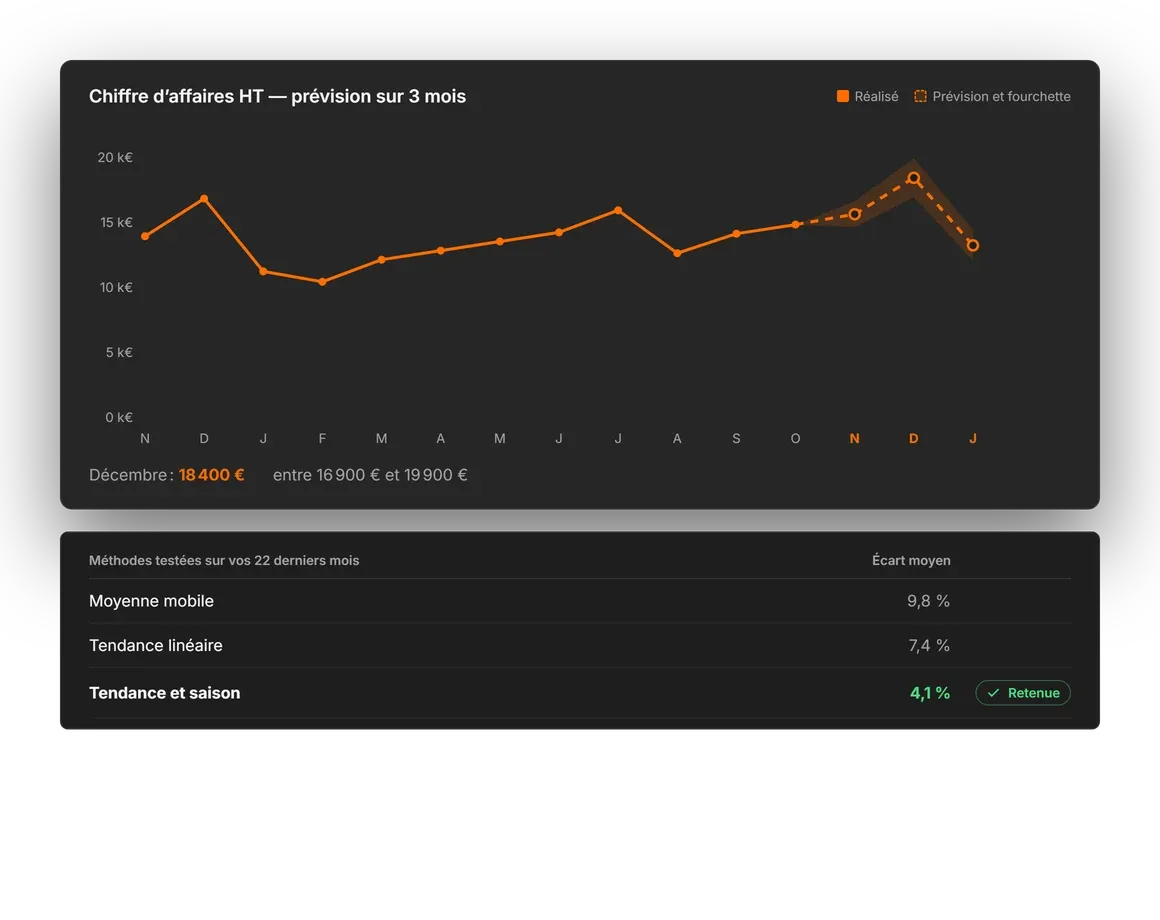
UNITICE tests several methods on your history, keeps the most reliable and always gives you a range.
Import
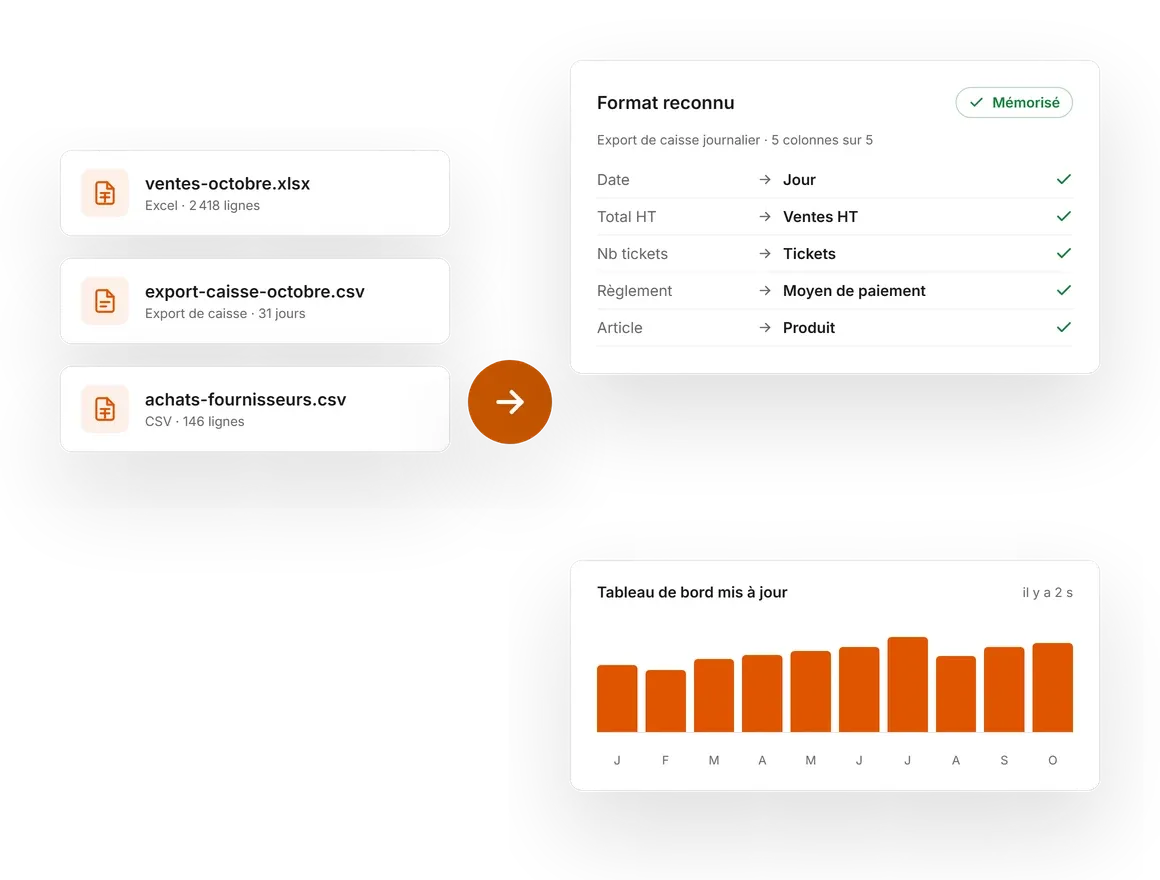
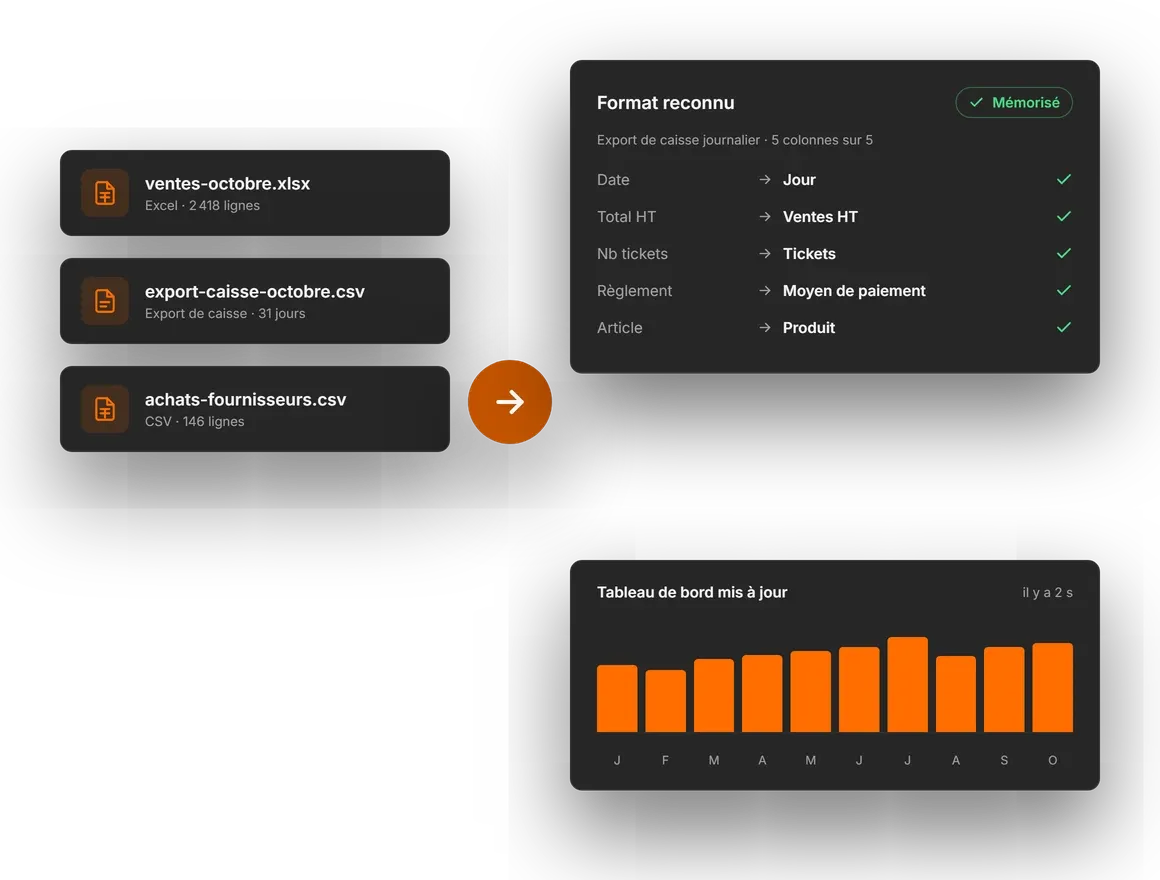
Drop your files. We take care of the rest.
Excel, CSV or a till export: UNITICE recognises the columns, remembers the format and builds your dashboards.
- Compatible with your files, whatever your till
Margin per product
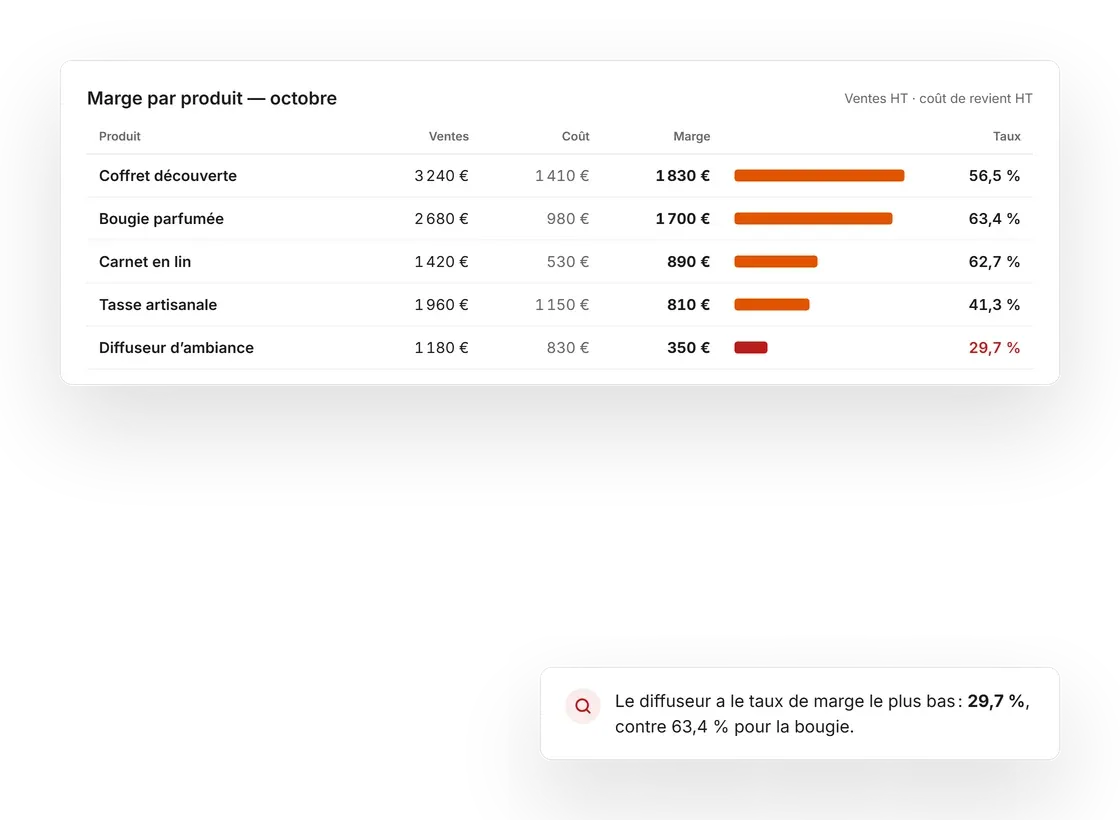
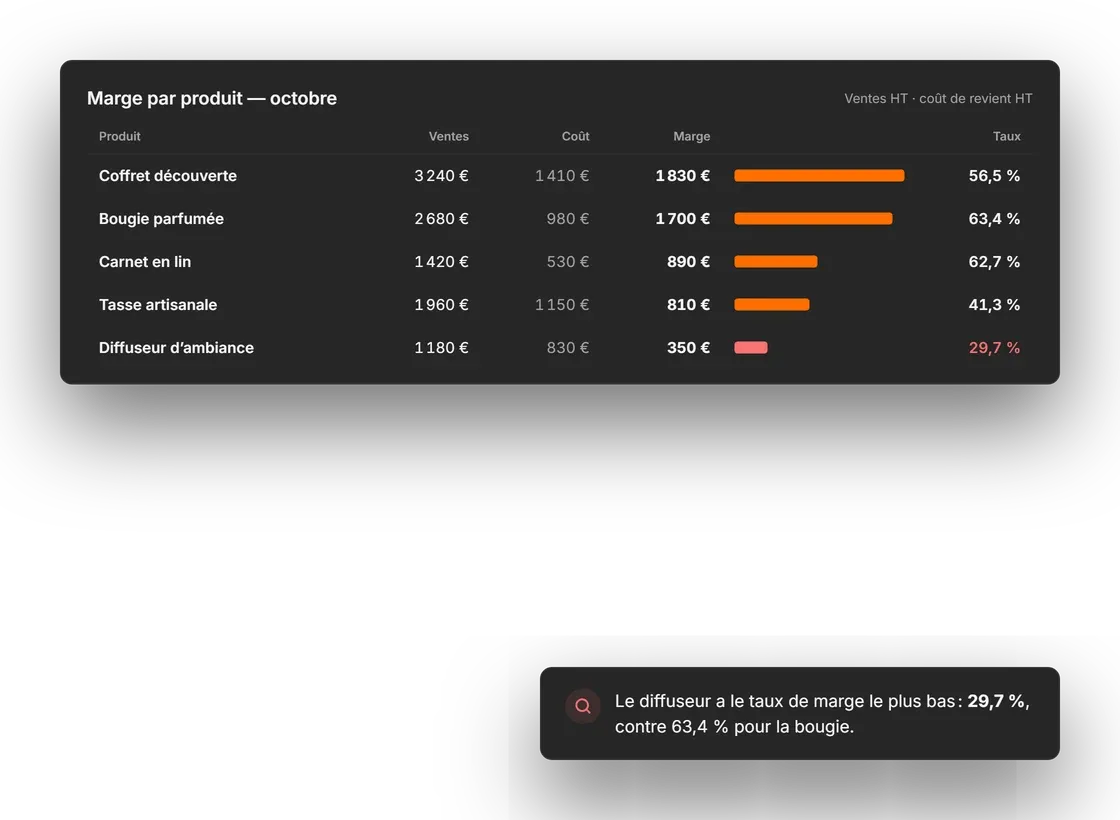
Know what really earns you money.
Sales, cost price and margin, product by product. The differences stand out.
Price
Adjust your prices gently, without unsettling your customers. (AI)
The AI analyses your sales history and proposes, product by product, a price increase or a price decrease. More revenue, in small touches that your customers do not feel.
- Hausses et baisses calculées sur vos données historiques
- Une proposition pour chaque produit
- Plus de chiffre d'affaires, sans à-coup pour vos clients
| Product | Current | Suggested | Difference |
|---|---|---|---|
| Discovery set | 39,00 € | 41,00 € | +2,00 € |
| Scented candle | 18,50 € | 19,50 € | +1,00 € |
| Linen notebook | 12,00 € | 12,00 € | unchanged |
| Room diffuser | 34,00 € | 31,00 € | −3,00 € |
The set sold just as well after its last rise: €2 more still fits what your customers are used to.
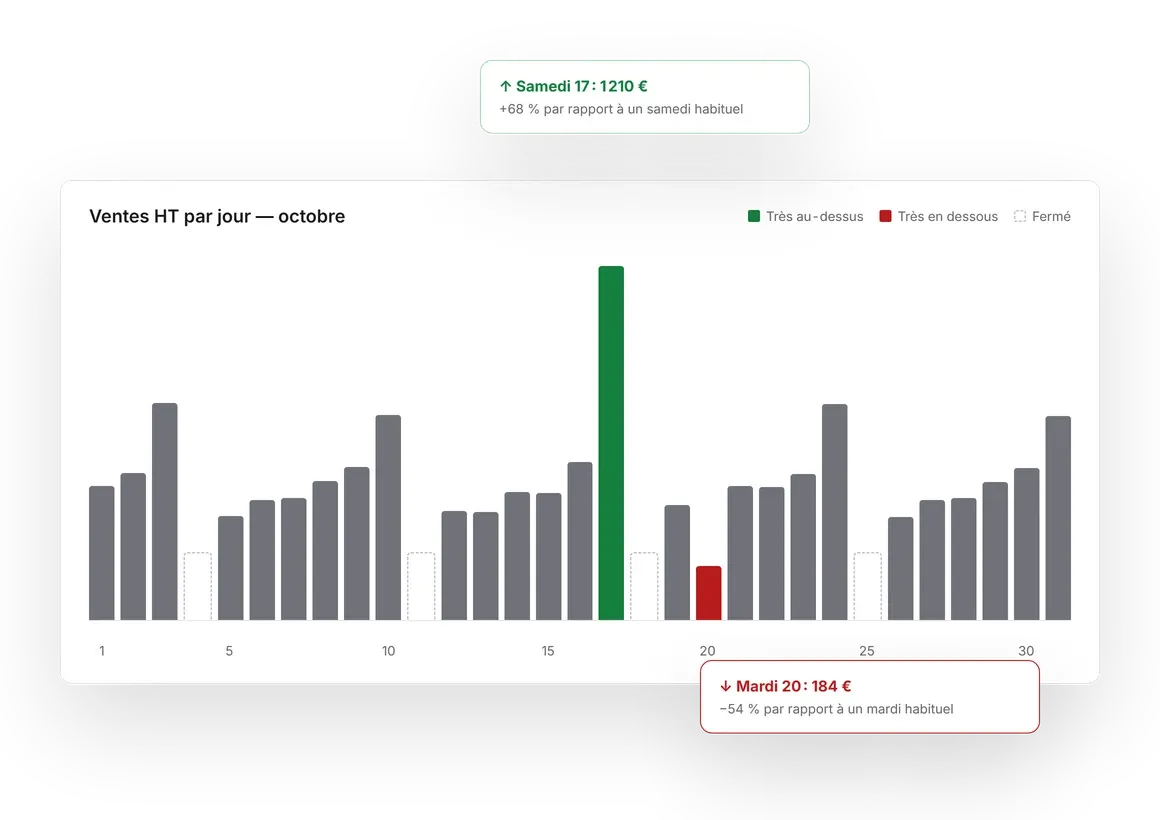
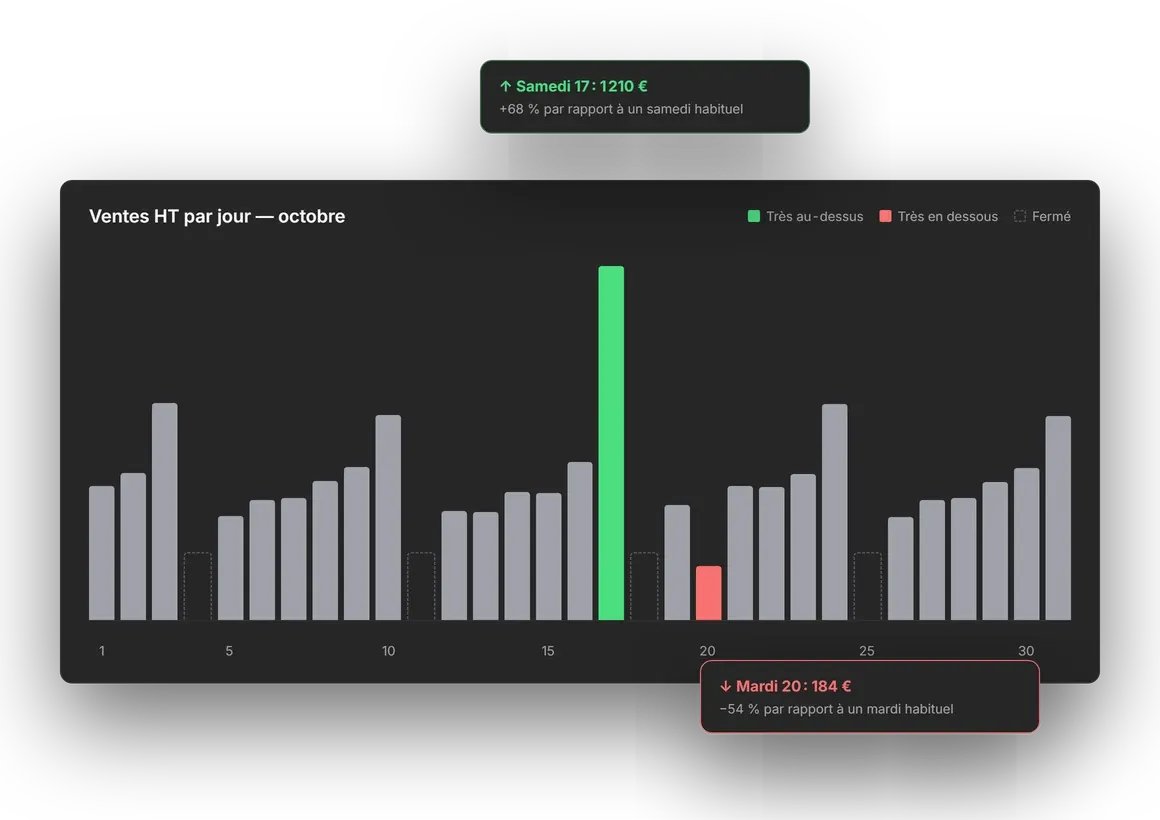
Unusual days
Spot what is out of the ordinary.
Days well above or well below the usual pattern are flagged, with the comparison that explains them.
Compare
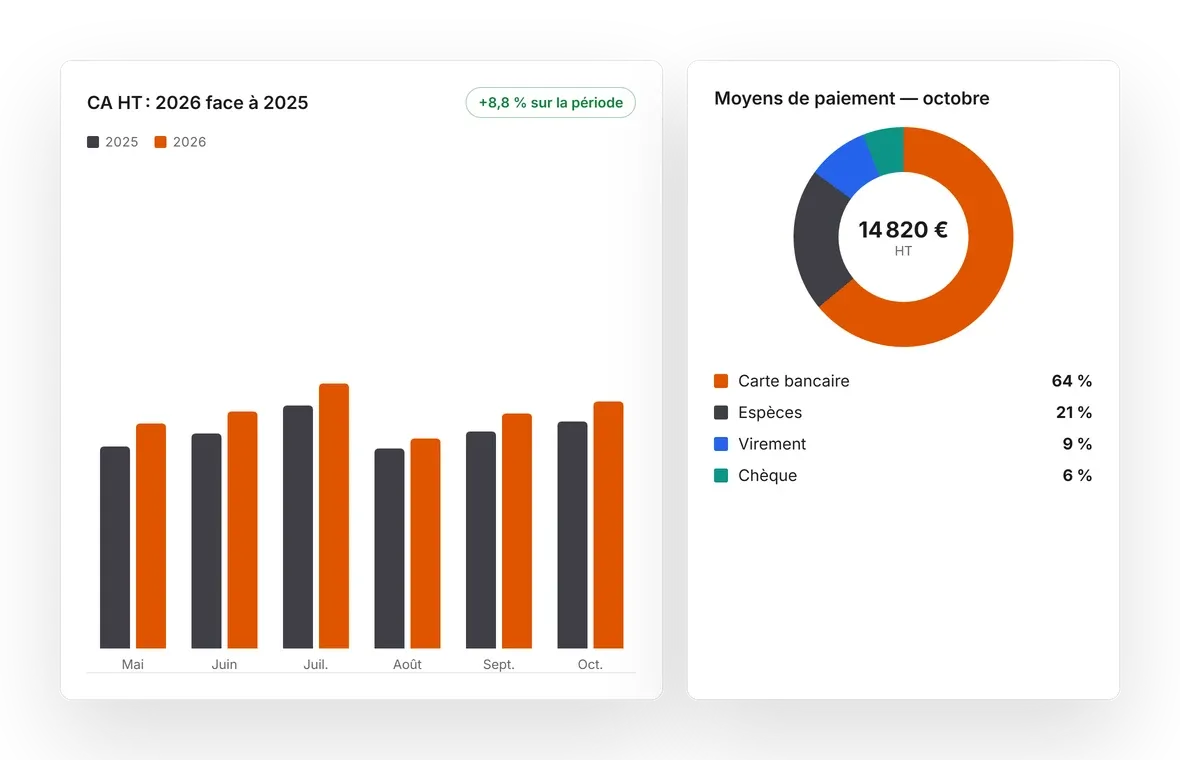
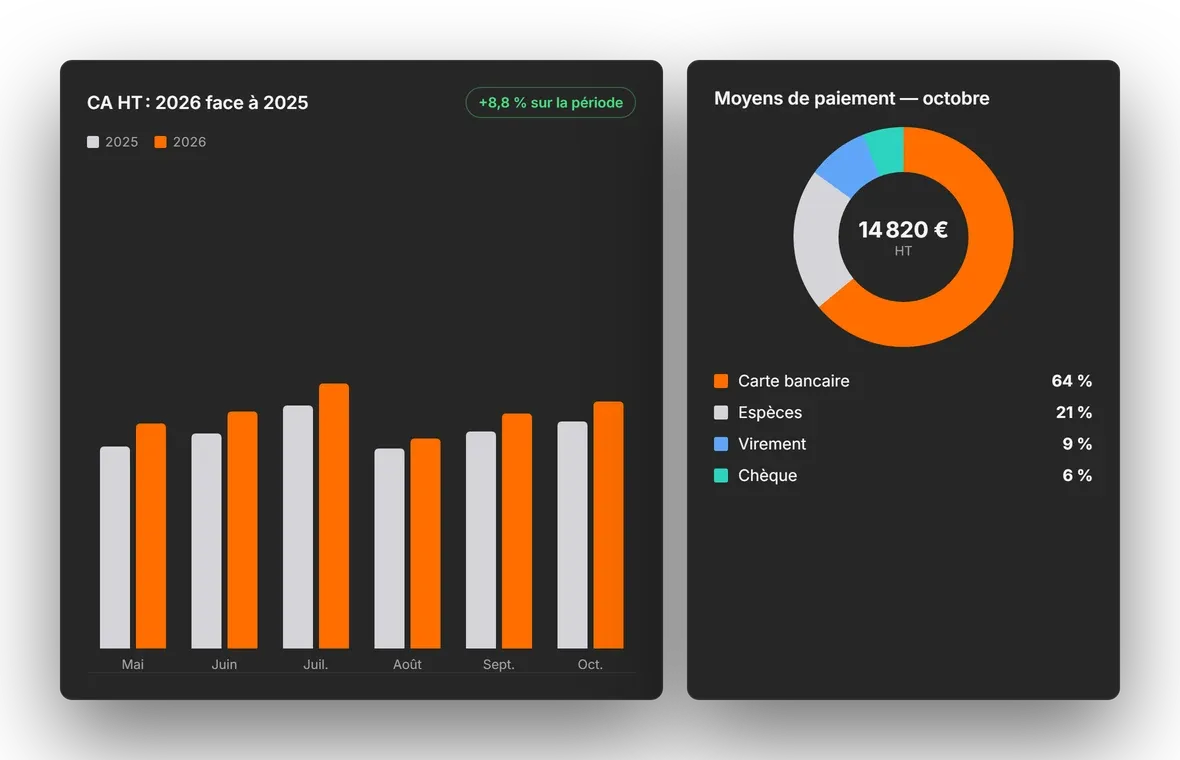
This month against last year, at a glance.
Compare two periods and track your payment methods, with no formula and no pivot table.
Reports
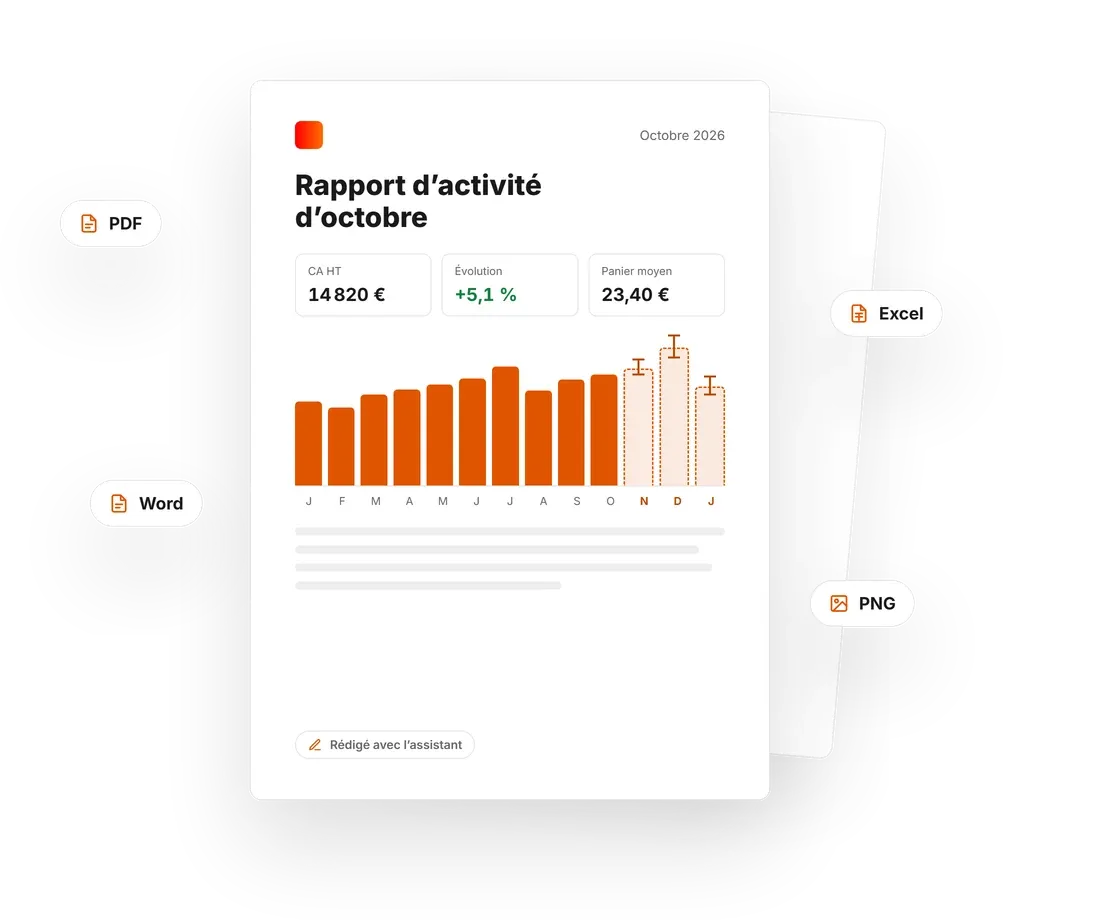
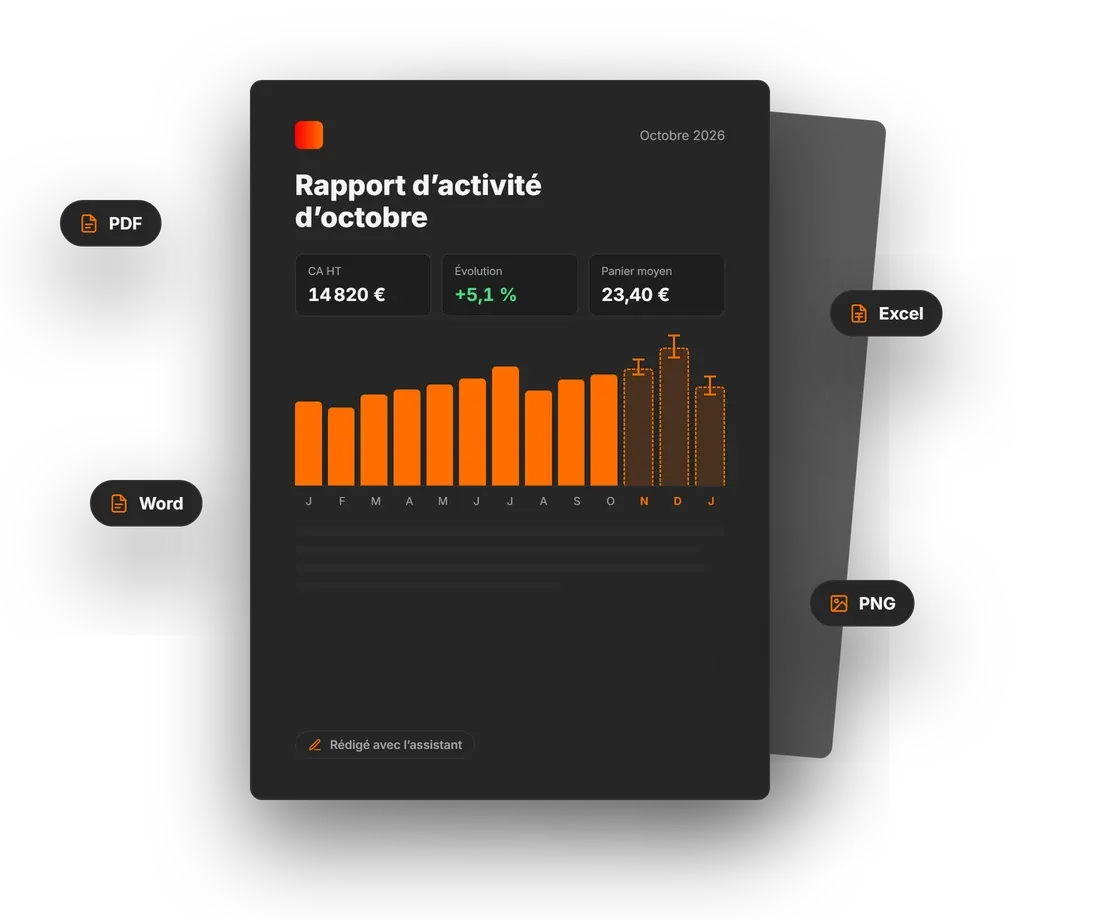
A report ready to share in one click.
Dashboard in PDF, report put together by hand or written with the assistant. Charts in PNG, data in Excel.
Trust
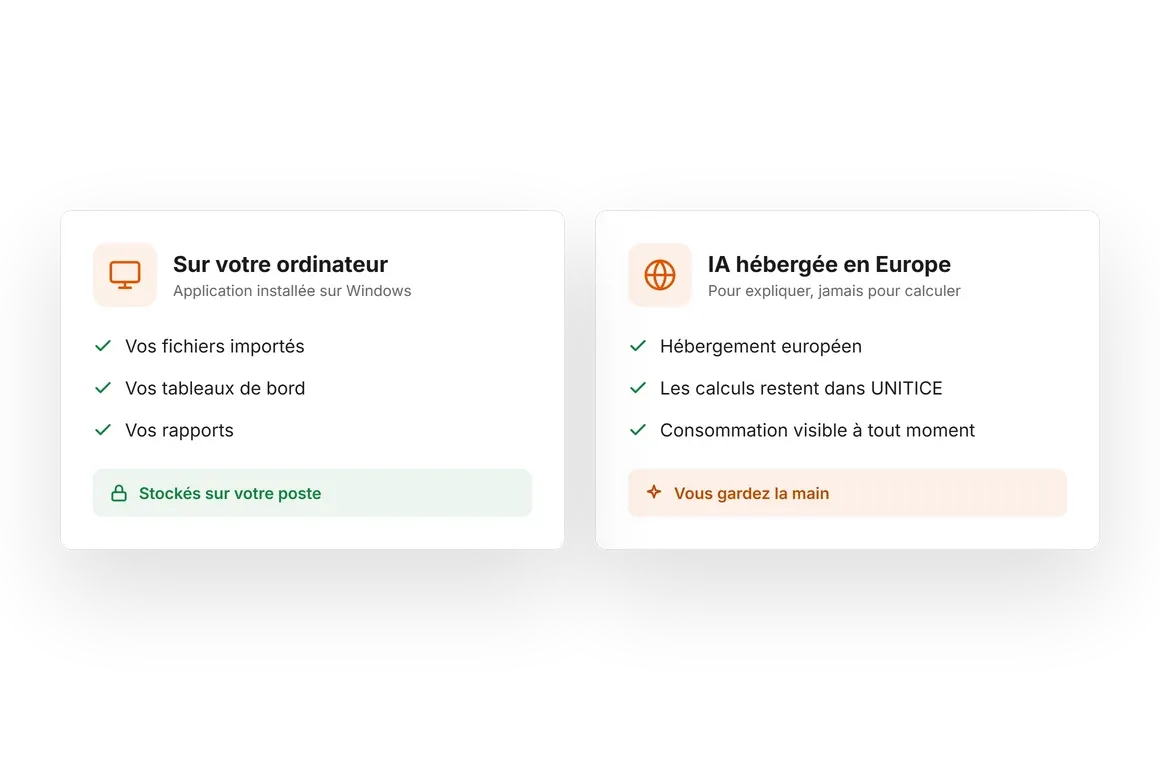
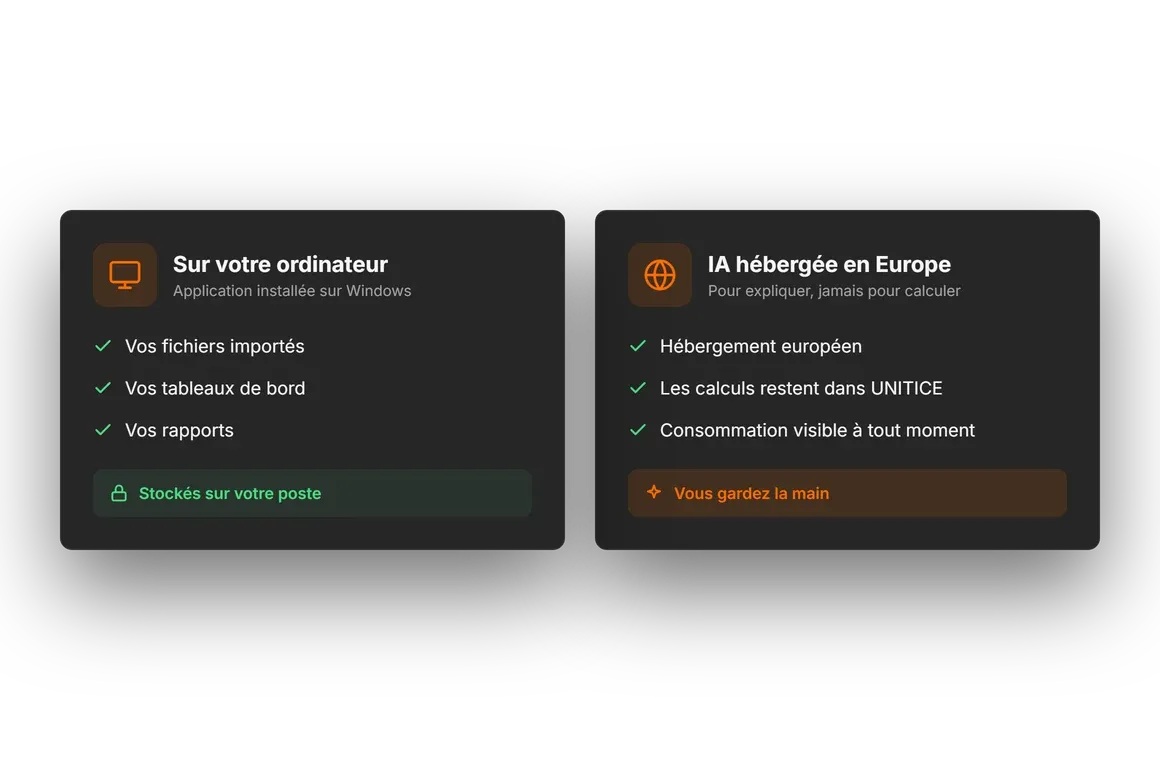
Your data stays with you.
The application installs on your computer and your files stay there. The artificial intelligence is hosted in Europe.
A single platform, from the sale to the decision.
Till, order kiosk and screen
Your sales recorded at the counter and in the dining room.
Online ordering and booking
Your online sales, on the same catalogue.
Payment
Taken at the terminal or online, with no re-entry.
Electronic invoices
Issued and received in Factur-X format.
E-reporting
Your sales to individuals, prepared.
Analysis and forecasts
Your figures explained, your months ahead.
| Back office dashboard | Analysis and forecasts | |
|---|---|---|
| How you search | Filters and charts | A question in French |
| Why a figure moves | Left to guess | Explained by the assistant, figures checked |
| The months ahead | The past only | A forecast and its range |
| Unusual days | To spot yourself | Flagged and explained |
| Price | Set by you | Rises and cuts proposed by AI |
| Data | Platform sales | Platform sales, your Excel or CSV files, or till exports |
| Reports | FEC, CSV, Excel or PDF exports | Report written with the assistant, in PDF, Word, Excel or PNG |
Frequently asked questions on sales analysis
Do you have to use the UNITICE till?
No. You import your sales as Excel, CSV or a till export: UNITICE recognises the columns and remembers the format.
Can the AI invent figures?
No. Each amount is calculated by UNITICE from your data, then checked in the answer.
Where is my data?
The application installs on your computer and your files stay there. The artificial intelligence is hosted in Europe.
How are forecasts made?
UNITICE tests several methods on your history, keeps the most reliable and always gives a range.
A single supplier, a single account: UNITICE
Till, electronic invoices, e-reporting, analysis and forecasts: everything is connected, with a single supplier.